Greyhound Trap Statistics UK
Best Greyhound Betting Sites – Bet on Greyhounds in 2026
Loading...
Contents
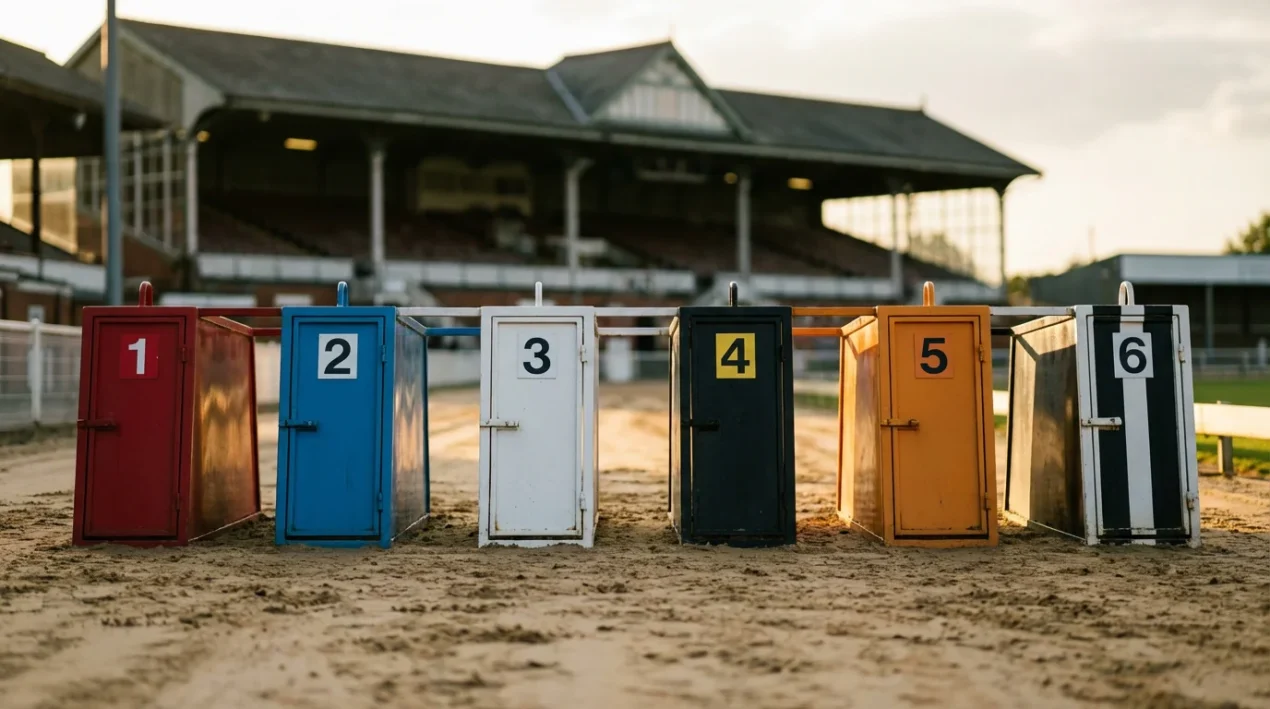
Trap Numbers Carry Data, Not Luck
The trap is not a random assignment — it’s a seeding decision with measurable consequences. In UK greyhound racing, each dog is drawn into one of six traps based on its running style. Railers go inside. Wide runners go outside. Middle seeds get the traps between. The racing manager at each track makes these decisions, and they shape the race before a single hare moves.
Because of this seeding logic and the physical geometry of each track, some traps produce more winners than others. Not by a dramatic margin — this isn’t a cheat code — but by enough to matter over hundreds of races. Punters who understand trap bias have a data layer that most casual bettors ignore entirely. Those who misunderstand it, treating trap statistics as a standalone system rather than a contextual tool, tend to lose money in a different but equally consistent way.
UK-Wide Trap Win Percentages
Across all GBGB tracks, trap 1 wins more often — but “more often” has limits. Aggregated UK data consistently shows the inside traps, particularly traps 1 and 2, producing a higher win percentage than the outside traps. The numbers fluctuate year to year, but as a broad pattern, trap 1 wins approximately 19-20% of races nationally, while trap 6 sits closer to 14-15%. In a perfectly balanced field, each trap would win 16.7% of the time. The deviation from that baseline is real, but it’s not enormous.
The reason for the inside-trap advantage is structural. Most UK greyhound tracks are oval circuits where the first bend turns left. Dogs breaking from trap 1 have the shortest path to the rail, the tightest line into the first bend, and the least distance to cover before establishing position. Dogs breaking from trap 6 must either show exceptional early speed to lead into the bend or accept being pushed wide, adding metres to their journey. Over a 480-metre race, an extra two or three metres of running adds roughly a length to the deficit. In a sport decided by fractions, that geometry matters.
However, national averages mask important variation. The seeding system itself creates a selection effect: trap 1 typically contains the strongest railer in the field, a dog specifically chosen for its ability to hold the inside line. That dog was placed there because the racing manager expects it to perform well from the inside. The trap’s win rate therefore reflects both the physical advantage of the position and the quality of the dogs assigned to it. Separating those two factors from aggregate data alone is difficult, which is why track-specific analysis is essential.
There’s also a distance factor. Sprint races over 210-280 metres tend to amplify trap bias because there are fewer bends and less time for a poorly drawn dog to recover. Over longer distances — 640 metres and above — the first-bend advantage diminishes as the race unfolds over multiple turns, and stamina becomes relatively more important than early position.
Track-by-Track Trap Bias Breakdown
Aggregate stats hide track-level truth — here’s where the real bias lives. Every UK greyhound track has its own circuit geometry: different bend radii, different distances from traps to the first turn, different cambers and surface conditions. These physical differences create distinct trap bias profiles that can diverge sharply from the national average.
Take Romford as an example. It’s a tight, compact circuit where the first bend arrives quickly after the traps. At Romford, the inside traps are heavily favoured in sprint races because there’s almost no time for wide runners to find a path before the field compresses. Trap 1 at Romford, over certain distances, wins at rates well above the national average. A punter relying solely on UK-wide trap stats would undervalue the Romford inside-trap bias, and one relying on Romford data at a wider track like Towcester would overvalue it.
Towcester, by contrast, has a longer run to the first bend and a more galloping circuit. The inside advantage still exists, but it’s less pronounced. Middle traps — 3 and 4 — perform closer to the inside traps because dogs drawn there have more time and space to find their running position before the field narrows. At tracks like this, the assumption that trap 1 is always best can actually lead you to overlook strong dogs drawn in the middle.
Monmore Green offers another variation. Its asymmetric bends mean that trap bias can differ between the first and second bends, and dogs drawn in trap 6 sometimes perform better than national data would predict because the wider line into Monmore’s first bend is less punishing than at sharper tracks. Sheffield, Hove and Nottingham each have their own profiles as well, and these shift further when you break the data down by distance.
The practical takeaway is that meaningful trap stats are track-and-distance specific. A trap 1 bias at Romford 225 metres tells you nothing about trap 1 at Sunderland 450 metres. If you’re going to use trap data — and you should — build or source statistics for the specific track and distance combinations you bet on. National averages are useful for understanding the general principle; local data is useful for making actual decisions.
Several websites and racing data providers publish track-level trap statistics, updated regularly from GBGB result feeds. The data is freely available in most cases. The work isn’t in finding it — it’s in applying it correctly alongside form, rather than treating a strong trap record as sufficient reason to back a dog.
How to Apply Trap Stats to Your Betting
Trap stats are context, not conviction — combine them with form. The most productive way to use trap data is as a secondary filter applied after you’ve assessed the form of each dog in a race. If two dogs have comparable recent form, similar grading trajectories and neither has a clear edge on times, trap bias can be the factor that tips the balance. It’s the tiebreaker, not the starting point.
Where trap data becomes genuinely powerful is in identifying negative value. If a dog is drawn in trap 6 at a track with a severe inside bias over the relevant distance, and the odds don’t reflect that disadvantage, you have information the market may be underweighting. This doesn’t mean the dog can’t win — it means the price should be longer than it would be from a neutral draw. If the bookmaker’s odds don’t account for that, the bet represents poor value even if the dog has strong form.
Conversely, a dog with moderate form drawn in a high-performing trap at a track where that trap overperforms can offer value precisely because the form alone doesn’t excite the market. The intersection of decent ability and favourable geometry creates situations where the price exceeds the true probability — and that’s where disciplined bettors find their edge.
One warning: don’t overfit. Small sample sizes at specific tracks and distances can produce misleading trap statistics. If trap 3 has won 28% of races over 480 metres at a particular track, but the sample is only fifty races, the figure is unreliable. Look for patterns backed by hundreds of data points, not dozens. And always check whether the data has been updated recently — track surfaces, rail positions and even trapping equipment can change between seasons, and bias patterns can shift with them.
Trap Data Is a Filter, Not a Strategy
Use traps to narrow the field, then let form do the selecting. Trap statistics are one of the most accessible data sets in greyhound racing and one of the most frequently misapplied. Knowing that inside traps win more often is the beginning of understanding, not the end. The punters who gain a real advantage from trap data are the ones who drill into track-specific numbers, combine them with form analysis, and use the information to assess value rather than to pick winners.
The trap tells you something about a dog’s likely journey through the race. What the dog does with that journey still depends on ability, fitness, and the other five runners. Data-informed betting means weighing all of those factors, not elevating one above the rest.